Ecosystem Targets and Supporting Indicators
Game Fish
The abundance of game fish is a reflection of the productivity of Long Island Sound and the effectiveness of coast-wide fishery management plans that seek to stabilize populations while maximizing harvest opportunities.
View Implementation Actions for Game Fish| Game Fish Count Per Tow | ||||||||
|---|---|---|---|---|---|---|---|---|
| Bluefish | Scup | Striped Bass | Summer Flounder | Tautog | Weakfish | Winter Flounder | Black Sea Bass | |
| 1984 | 23.41 | 10.72 | 0.02 | 0.99 | 2.75 | 1.55 | 111.96 | 0.16 |
| 1985 | 19.01 | 30.97 | 0.00 | 1.19 | 1.47 | 6.35 | 66.81 | 0.27 |
| 1986 | 13.66 | 25.76 | 0.00 | 1.73 | 1.50 | 13.57 | 61.50 | 0.12 |
| 1987 | 14.32 | 18.54 | 0.05 | 1.40 | 0.71 | 0.73 | 67.92 | 0.05 |
| 1988 | 15.49 | 39.70 | 0.04 | 1.42 | 0.65 | 3.54 | 100.96 | 0.04 |
| 1989 | 26.25 | 65.09 | 0.06 | 0.14 | 1.09 | 8.69 | 135.23 | 0.08 |
| 1990 | 23.88 | 69.48 | 0.16 | 0.87 | 1.00 | 5.71 | 170.12 | 0.10 |
| 1991 | 33.43 | 311.57 | 0.15 | 1.26 | 0.92 | 12.11 | 118.95 | 0.07 |
| 1992 | 25.22 | 83.73 | 0.22 | 1.02 | 0.82 | 3.22 | 54.31 | 0.03 |
| 1993 | 18.92 | 77.06 | 0.27 | 1.11 | 0.42 | 4.18 | 53.34 | 0.07 |
| 1994 | 32.06 | 92.52 | 0.30 | 0.55 | 0.44 | 11.21 | 74.35 | 0.12 |
| 1995 | 24.46 | 59.14 | 0.59 | 0.54 | 0.15 | 5.64 | 48.11 | 0.07 |
| 1996 | 20.80 | 61.46 | 0.63 | 2.19 | 0.49 | 15.49 | 93.05 | 0.11 |
| 1997 | 37.90 | 41.28 | 0.85 | 2.50 | 0.40 | 12.93 | 57.41 | 0.10 |
| 1998 | 31.41 | 103.27 | 0.97 | 1.72 | 0.42 | 5.28 | 59.36 | 0.04 |
| 1999 | 45.31 | 537.68 | 1.10 | 2.68 | 0.40 | 31.36 | 32.80 | 0.08 |
| 2000 | 20.57 | 521.10 | 0.84 | 1.91 | 0.57 | 63.42 | 33.67 | 0.22 |
| 2001 | 24.24 | 177.64 | 0.61 | 4.42 | 0.70 | 40.51 | 46.40 | 0.25 |
| 2002 | 18.75 | 348.70 | 1.30 | 6.12 | 0.91 | 41.45 | 25.49 | 0.67 |
| 2003 | 28.53 | 152.23 | 0.87 | 3.39 | 0.52 | 49.46 | 21.22 | 0.21 |
| 2004 | 29.13 | 291.46 | 0.56 | 1.95 | 0.54 | 59.07 | 16.45 | 0.22 |
| 2005 | 18.89 | 424.06 | 1.17 | 2.41 | 0.57 | 26.00 | 17.47 | 0.07 |
| 2006 | 15.66 | 116.75 | 0.61 | 1.35 | 0.64 | 1.50 | 7.50 | 0.05 |
| 2007 | 30.66 | 475.29 | 1.02 | 1.89 | 0.48 | 63.96 | 20.58 | 0.26 |
| 2008 | 14.28 | 303.26 | 0.57 | 3.09 | 0.50 | 9.11 | 22.34 | 0.22 |
| 2009 | 18.11 | 139.38 | 0.60 | 3.12 | 0.40 | 6.65 | 18.98 | 0.32 |
| 2010 | N/A* | N/A* | 0.40 | N/A* | 0.25 | N/A* | 20.88 | 0.28 |
| 2011 | 11.10 | 198.23 | 0.48 | 2.56 | 0.38 | 12.27 | 16.68 | 0.27 |
| 2012 | 15.06 | 223.52 | 0.43 | 3.74 | 0.44 | 22.27 | 12.02 | 0.83 |
| 2013 | 9.71 | 40.68 | 0.67 | 3.07 | 0.43 | 7.50 | 6.35 | 0.97 |
| 2014 | 18.61 | 182.58 | 0.41 | 1.71 | 0.51 | 41.56 | 4.10 | 2.73 |
| 2015 | 8.42 | 422.23 | 0.20 | 2.03 | 0.47 | 31.05 | 3.93 | 1.94 |
| 2016 | 11.25 | 307.01 | 0.48 | 1.92 | 0.59 | 6.33 | 3.40 | 1.78 |
| 2017 | 8.05 | 212.15 | 0.34 | 1.35 | 0.43 | 8.37 | 0.76 | 4.56 |
| 2018 | 4.00 | 228.62 | 0.57 | 2.43 | 0.62 | 25.84 | 2.41 | 4.17 |
| 2019 | 11.19 | 129.46 | 0.91 | 1.44 | 0.59 | 15.44 | 1.50 | 3.79 |
| 2020 | N/A** | N/A** | N/A** | N/A** | N/A** | N/A** | N/A** | N/A** |
| 2021 | 7.24 | 221.80 | 0.38 | 3.05 | 0.72 | 28.88 | 1.44 | 5.25 |
| 2022 | 4.61 | 404.31 | 0.92 | 2.59 | 0.78 | 35.07 | 1.57 | 3.49 |
| 2023 | 4.41 | 121.81 | 0.32 | 4.29 | 0.74 | 13.32 | 1.39 | 5.38 |
WHAT ARE GAME FISH?
Game fish are those species prized by anglers for their size and strength which makes fishing for them an exciting sport. All of these fish are also harvested commercially and are managed by regulations restricting minimum harvest size, number, and season in order to keep their abundance stable. In addition, state health departments monitor many of these species for contamination by toxic substances such as mercury and issue consumption advisories when needed.
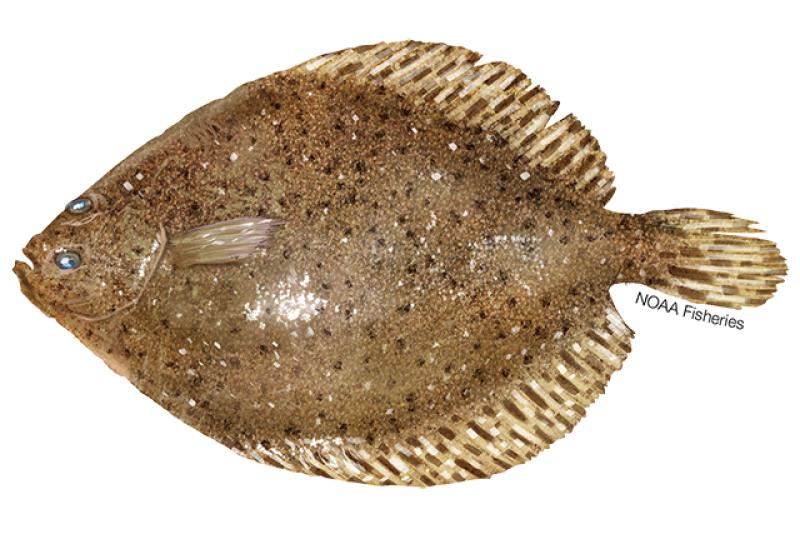
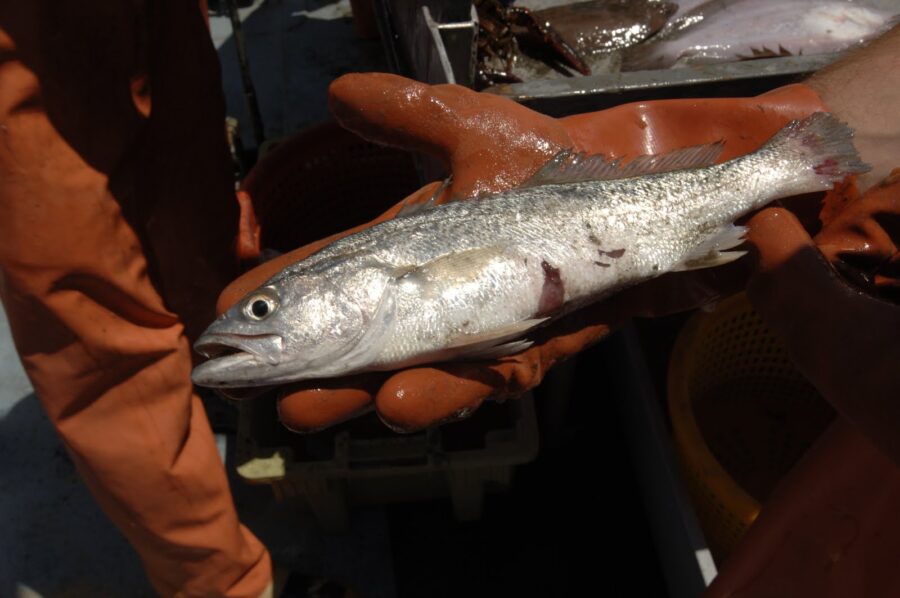
The Long Island Sound Trawl Survey (LISTS), conducted by the Connecticut Department of Energy and Environmental Protection since 1984, has provided independent monitoring of important recreational species in Long Island Sound. Seven of these species are identified in this chart—bluefish (Pomatomus saltatrix), scup (Stenotomus chrysops), striped bass (Roccus saxatillis); summer flounder (Paralichthys dentatus), or fluke, tautog, (Tautogo onitis), or blackfish, weakfish (Cynoscion regalis), and winter flounder (Pseudopleuronetes americanus). These abundance indices are used by fishery managers for local and regional assessment of stock condition, and to provide a more complete annual inventory of LIS fishery resources.
WHAT DOES THIS INDICATE?
The abundance of game fish is a reflection of the productivity of Long Island Sound and the effectiveness of coast-wide fishery management plans that seek to stabilize populations while maximizing harvest opportunities.
STATUS
In general, Long Island Sound abundance of boreal game fish (e.g., winter flounder) is stable or declining while the abundance of temperate finfish species (e.g., weakfish & summer flounder) are variable. The aggregate average is roughly stable, but highly variable:
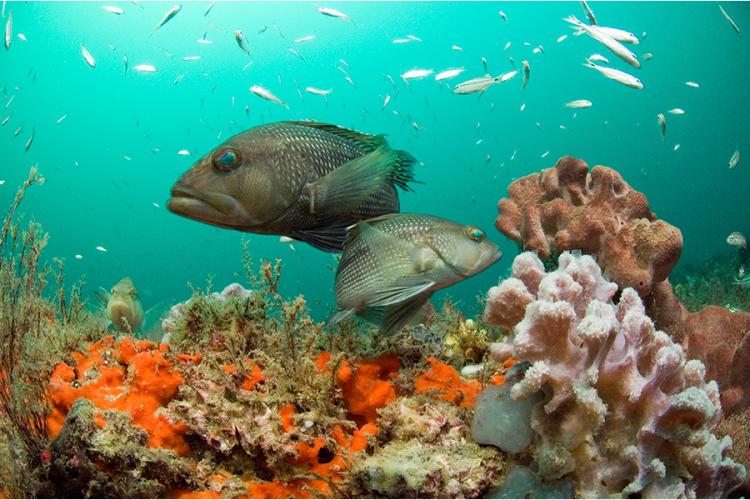
- Black sea bass: The black sea bass abundance has substantially increased in the last decade. The species is classified as a warm water species, meaning due to increasing temperatures in the Sound, the black sea bass has flourished. This species is experiencing a substantial shift northward in its range. In response, northern states, also experiencing the same influx as the Sound, have exploited the fishery as they are highly sought after – they taste great! Commercial for hire and private anglers have enjoyed higher abundance and fishing opportunities. However, their increase has also disrupted the balance of the food web. Sea bass, for example, preys on the American lobster, further contributing to causes leading to its decline in Long Island Sound. It is important to recognize this predator-prey relationship in future management practices as other fishery species may be impacted by temperature-induced geographic range shifts.
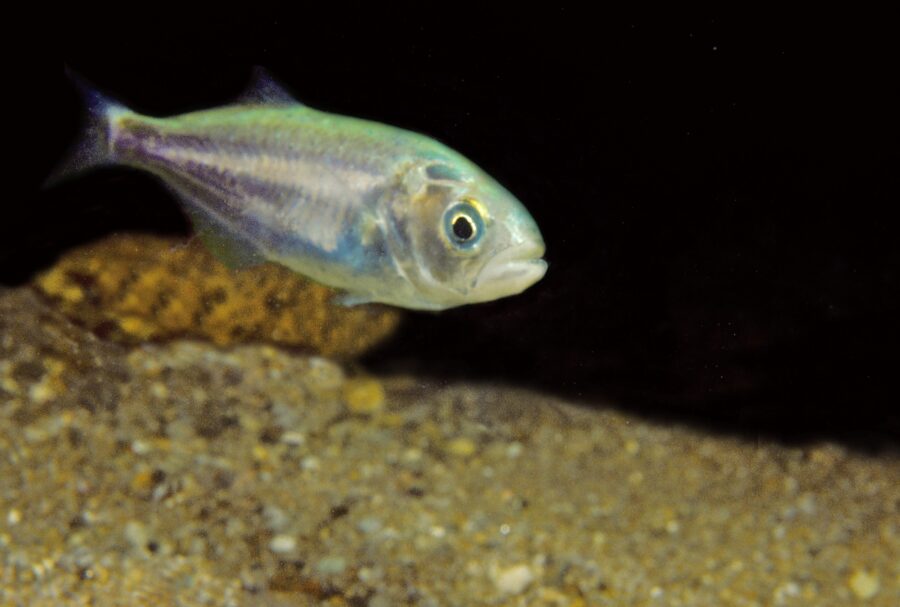
- Bluefish: The abundance of adult bluefish has declined since the late 1990s. New regulations have been implemented, such as limiting the daily total possessions to 3 fish for recreational fishermen or 5 fish for anglers aboard licensed party/charter boats, to address the overfished status from Atlantic States Marine Fisheries Commission.
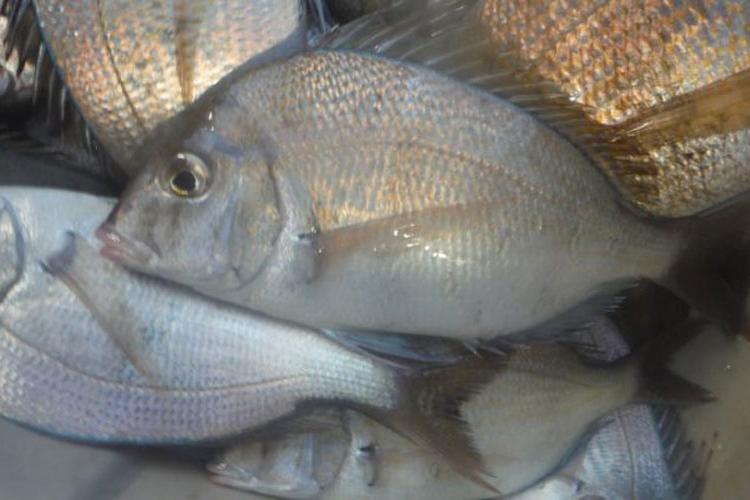
- Scup: Recent numbers of adult scup from the Long Island Sound fall trawl survey remain high relative to observations made between 1984 and 1998. Adult scup in Long Island Sound are, particularly at high abundance levels. Currently, scup that are two years and older have produced four of the top five highest abundance indices (both spring and fall) since 2015. These trends suggest the scup’s spawning stock potential is stable which is advantageous for the health of future cohorts. Coast-wide management using annual recreational and commercial quotas, as well as commercial gear restrictions since the mid to late ’90s, has helped improve the health of this fishery.
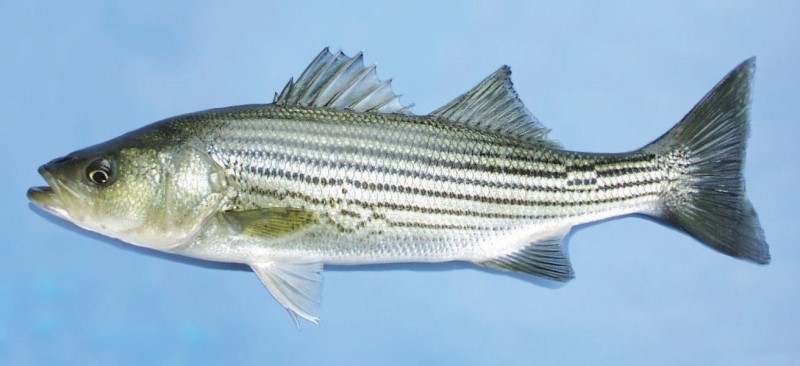
- Striped bass: The striped bass fishery was historically overfished and was the first species to be targeted for stock rebuilding in 1984. Restrictive harvest limits at that time had allowed the stock to grow to unprecedented levels. This growth is illustrated with the increasing abundance trends early in the survey’s time series. In 1995, the striped bass stock was declared “officially recovered” and fishing regulations were liberalized. New York and Connecticut lowered the minimum size restriction for striped bass to 28 inches in coastal waters and had these regulations (or similar to) in effect from 1995 to 2014. With declining trends of abundance over the last decade and a new Atlantic States Marine Fisheries Commission benchmark stock assessment in 2018, the fishery was declared overfished and overfishing was occurring. New coastal regulations have been updated to reflect the current status and to rebuild the stock. Both Connecticut and New York currently have a slot limit of one fish per angler between 28-35 inches.
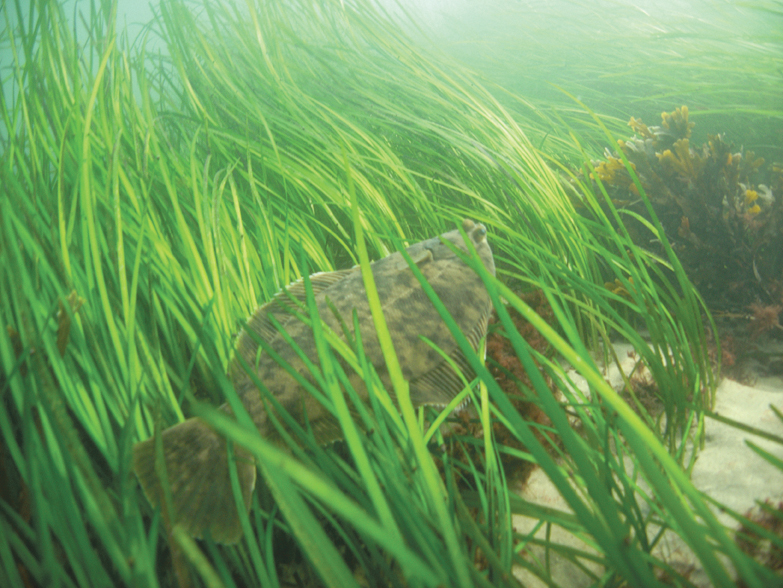
- Summer flounder: This species is considered a management success; it has been under very tight management regulations and the population seems to have responded. Abundance has increased since the mid-1990s, showing higher abundances since the early 2000s. The current stock status coastally through a recent benchmark stock assessment does not have summer flounder as overfished nor is it experiencing overfishing. Recent increases in water temperature within Long Island Sound may be contributing to the increase in abundance of summer flounder as they are warm-water species. This is particularly evident since 2005 where more summer flounder show up earlier each year in the survey; with most years now in April as opposed to late May or early June.
- Tautog: Spring survey indices for this species have remained low and below the time-series average since 1993 except for a short-lived increase in abundance recorded in 2002. This species is one of the few warm temperate species that has not increased in abundance over the last few decades. In an effort to rebuild the stock, the NYSDEC and CT DEEP have recently instituted more restrictive fishing regulations. In 2016, Long Island Sound became its own “region” for assessment purposes and is now its own discrete area identified through Atlantic States Marine Fisheries Commission for tautog. The 2016 assessment currently models the Long Island Sound stock as overfished and is also currently experiencing overfishing. Within the last decade, the population seems to have stabilized at low levels.
- Weakfish: Abundance indices have been highly variable over the last few years, but over the last decade have been generally higher than in the 1980s and 1990s, but lower than the 2000s. Most of the weakfish caught in the Long Island Sound Trawl Survey are small, young fish, suggesting that the Sound primarily functions as a nursery area for this species. Both overfishing and increased predation (by other fish such as striped bass) have been implicated in the low relative abundance of adult fish. Weakfish are a major component of the gill-net, pound-net, haul-seine, and trawl fisheries along the coast.
- Winter flounder: At one time, winter flounder supported a thriving commercial and recreational fishery, but since 2010 winter flounder springtime abundance indices have been the lowest on record. This species does well in very cold winters, but may be experiencing increased competition and/or predation by mid-Atlantic finfish predators, as well as cormorants and seals.
DATA NOTES
- The above graph depicts data from CT DEEP’s spring and fall trawl surveys. For this chart, the season in which abundance is greatest is used for each species−fall for bluefish, scup, summer flounder, and weakfish and spring for winter flounder, striped bass, tautog, and black sea bass.
- *In fall 2010, sampling for bluefish, scup, summer flounder, and weakfish was cancelled because the CT DEEP’s research vessel was out of service due to repairs.
- **In 2020, CT DEEP was unable to conduct its Long Island Sound Trawl Survey due to COVID-19 restrictions.
- The survey uses geometric mean instead of arithmetic mean to find the most frequently observed number of fish collected per tow. In a natural environment such as Long Island Sound fish have a “patchy” distribution, i.e. some areas will have a very high abundance of fish, and other areas very low abundance or no fish at all. An arithmetic mean can be easily biased by unusually high or low values so that it doesn’t reflect the true center of a data set. The geometric mean minimizes the effects of very high or low values using a log transformation and is a better average for this type of biological data. For further information see: A Study of Marine Recreational Fisheries in Connecticut: March 1, 2009-Feb. 28, 2010, CT DEEP Fishing Publications Web site
