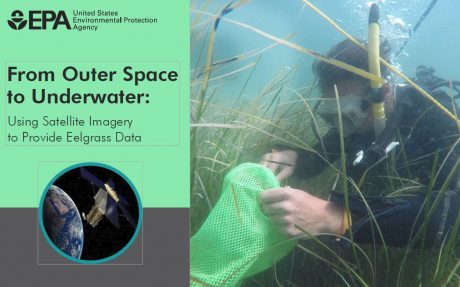
EPA Conducts Eelgrass Survey in Niantic Bay and other East Coast Embayments
EPA is testing a new method to use satellite remote sensing imagery for mapping eelgrass in Niantic Bay and two other Atlantic seaboard sites this summer. Read about it below:
What is EPA doing?
- EPA scientists will be collecting data on eelgrass distribution and abundance in Niantic Bay (CT) in Long Island Sound, West Falmouth Harbor (MA), Pleasant Bay (MA), and Ninigret Pond (RI) during the Summer of 2018. The data includes taking samples of the eelgrass and measuring the size and abundance of eelgrass beds.
- This data will be compared to satellite remote sensing imagery in these areas to determine if satellite remote sensing can be used to accurately assess seagrass abundance, in detail, in temperate waters.
Why is EPA doing it?
• Eelgrass, a submerged aquatic vegetation, is an important habitat to protect and restore in coastal New England.
• Currently, EPA must rely on dive surveys to generate seagrass data–combining satellite imagery could provide a more cost effective alternative.
How can satellite images measure Submerged Aquatic Vegetation (eelgrass)?
- Advances in understanding the optics of shallow water environments, submerged vegetation canopies and seagrass physiology, combined with improved spatial resolution of remote sensing platforms, now enable eelgrass ecosystems to be monitored at a variety of time scales from earth-orbiting platforms (satellites).
- This demonstration project will develop tools for estimating eelgrass distribution and biomass in estuaries of southern New England and forecast primary production from the satellite imagery.
How does it compare to existing monitoring methods?
- Most states have established seagrass mapping programs that generally collect data on seagrass distribution, but the techniques involved are inefficient cost-wise and the frequency of data collection varies greatly by state.
- These programs are not designed, nor have the capability of collecting more detailed seagrass abundance data, which is also of great interest to natural resource managers. This situation results in big data gaps that under represent seagrass distribution and limit interpretation of water quality events influencing eelgrass habitat. Currently, resource managers must rely on dive surveys to generate this seagrass abundance data.
- This study will assess the ability of satellite remote sensing data to accurately estimate seagrass distribution and abundance in temperate coastal waters. This approach could provide a consistent, cost effective alternative for resource managers to gather seagrass abundance data and manage this valuable resource.
What are the impacts?
• Generate sufficient information to understand the loss of eelgrass habitat from detrimental impacts and the benefits of nutrient management efforts.
• Provide a consistent, cost effective alternative for local, state, and federal government resource managers to gather seagrass abundance data and manage this valuable resource.
• Advance protection of human health and the natural environment in New England.
This project is being done by the US EPA Office of Research and Development RARE (Regional Applied Research Effort), which responds to the high-priority research needs of Regions and helps support environmental decision-making. The United States Geological Survey (USGS) and the National Geospatial-Intelligence Agency (NGA) provide high resolution satellite imagery.
See gallery of photos that have been taken on the eastern Seaboard by EPA scientists. The photo of the diver was taken by Chuck Protzmann and the rest of the underwater photos were taken by Phil Colarusso.
[ngg_images source=”galleries” container_ids=”19″ display_type=”photocrati-nextgen_basic_thumbnails” override_thumbnail_settings=”0″ thumbnail_width=”130″ thumbnail_height=”98″ thumbnail_crop=”1″ images_per_page=”20″ number_of_columns=”0″ ajax_pagination=”0″ show_all_in_lightbox=”1″ use_imagebrowser_effect=”0″ show_slideshow_link=”0″ slideshow_link_text=”[Show as slideshow]” order_by=”sortorder” order_direction=”ASC” returns=”included” maximum_entity_count=”500″]
