Hypoxic Area is Down, Continuing Positive Trend

Despite the pandemic, the Connecticut Department of Energy and Environmental Protection and the Interstate Environmental Commission completed their 30th consecutive season of summer water quality monitoring in Long Island Sound in 2020. The water samples collected and analyzed by CT DEEP and IEC showed a reduction in the maximum area of hypoxic (or oxygen-depleted) water in the bottom waters of Long Island Sound from the previous season, a key indicator in tracking water quality in Long Island Sound.
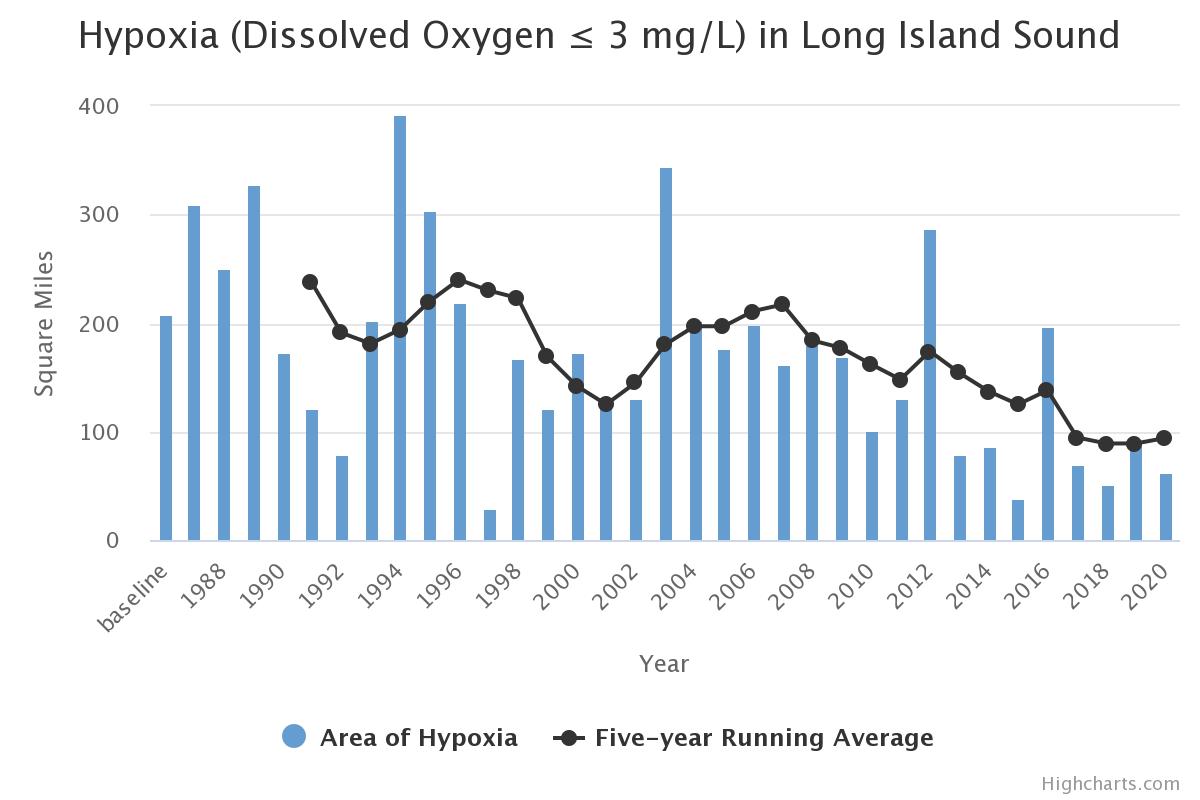
The total area of hypoxic waters was 63 square miles compared to 89 square miles from 2019. Strong wind events, including from Hurricane Isaias, in late July and early August, likely contributed to the reduction. Strong winds from the east in the summer can help mix the bottom waters with the more oxygen-rich surface waters to improve oxygen levels in the bottom.
Hypoxia occurs in coastal waters when the bottom waters lack sufficient oxygen (3 mg/Liter of dissolved oxygen or less) to support marine life. Often called a “dead zone,” the area of hypoxic water is an important water quality indicator. It usually occurs in the summer in bottom waters when the more oxygenated surface waters heat up and become less dense, making it harder for surface waters to mix with the denser, less oxygenated bottom layers.

Despite the decrease, the five-year rolling average in the hypoxic area, LISS’s standard to measuring long term progress, increased slightly from 89 square miles in 2019 (the average of the years 2015-2019) to 94 square miles in 2020 (the average of the years 2016-2020). More important, however, the long-term trend for reducing hypoxia continues to show a significant improvement. The current five-year average of the hypoxic area represents a 61 percent decline from 1992-1996 when the average hypoxic area was 240 square miles, a period in which nearly 20 percent of the Sound suffered from hypoxic conditions.
In assessing trends, LISS uses the five-year rolling average because conditions in any given year could be impacted by varied factors, such as extreme patterns of heat or precipitation.
The summer sampling is part of the year-round Long Island Sound Water Quality Monitoring Survey, which is funded by the Long Island Sound Study. The program has been in effect since the 1980s to help track a major goal of LISS to reduce the area and severity of hypoxia in the bottom waters. As part of this effort EPA and the states of Connecticut and New York, working with municipalities, are implementing a program to reduce nitrogen, a nutrient that in excess leads to the conditions that result in hypoxia.
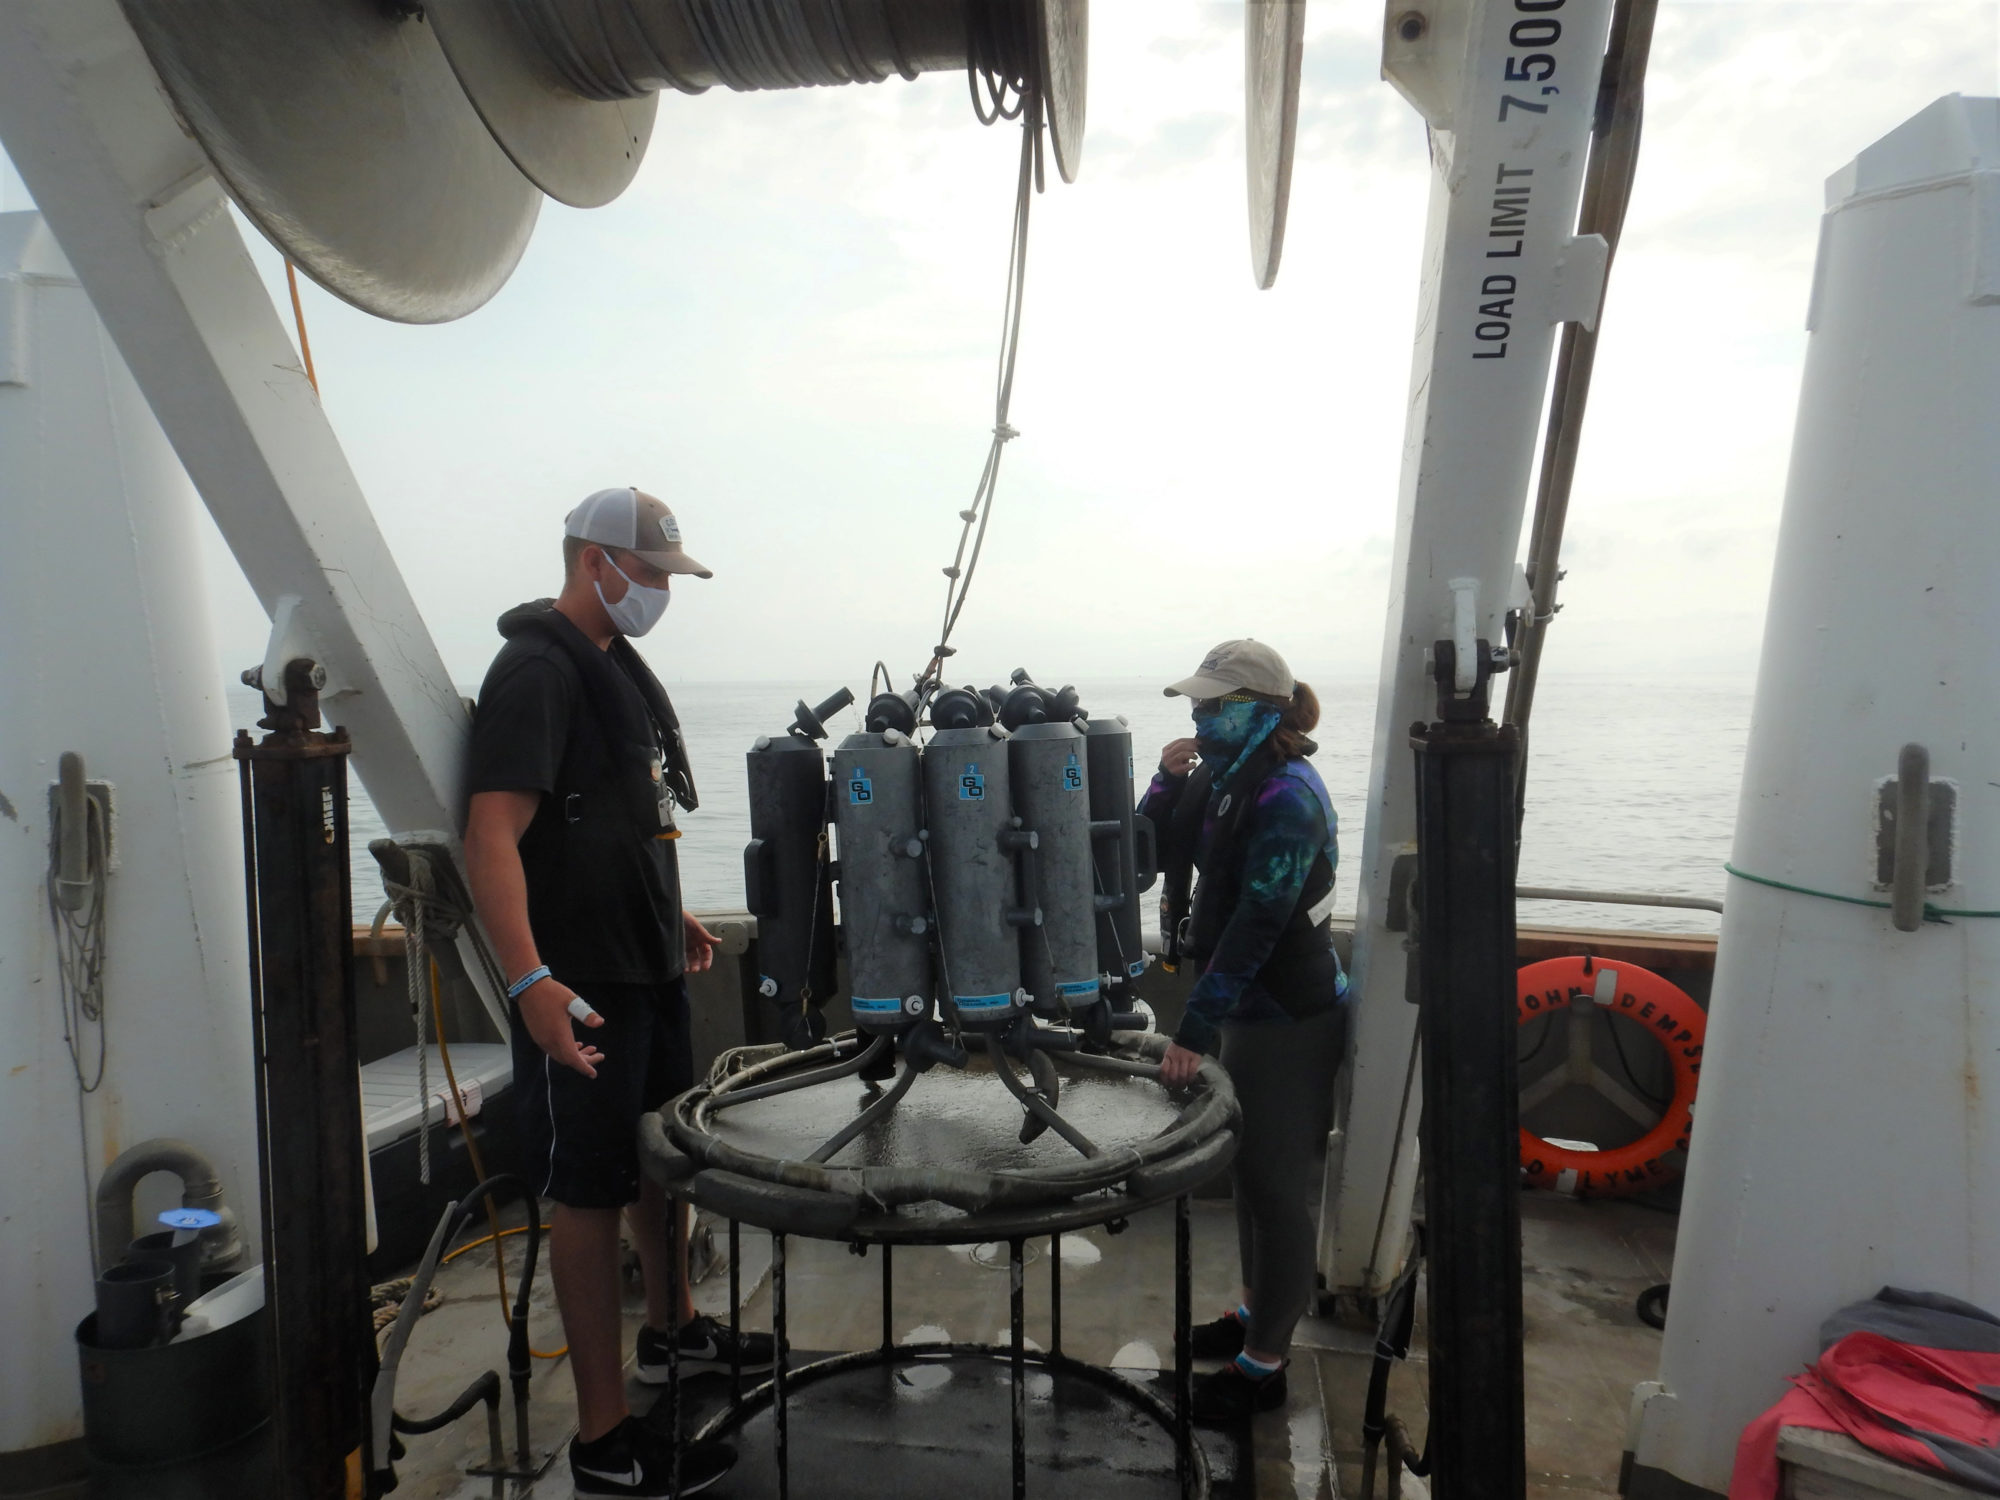
CT DEEP and IEC took over the water quality monitoring program in 1991. As a result of the pandemic, both CT DEEP and IEC canceled its vessel-based monitoring programs in April and May. They resumed in June with reduced crews in order to maintain social distancing and masking practices. Hypoxia was first detected on July 7 and last detected on Sept. 10. The duration of hypoxia, which is calculated from samples taken at three water quality monitoring stations, lasted 43 days. It did not include the period between Aug. 16 and Sept. 7 when oxygen levels at the three stations, which are located in the western-most part of the Sound, were greater than 3.0 mg/L.
More information about efforts to improve water quality in the Sound is available in the Extent of Hypoxia and the Nitrogen Loading Ecosystem Targets on the LISS website.